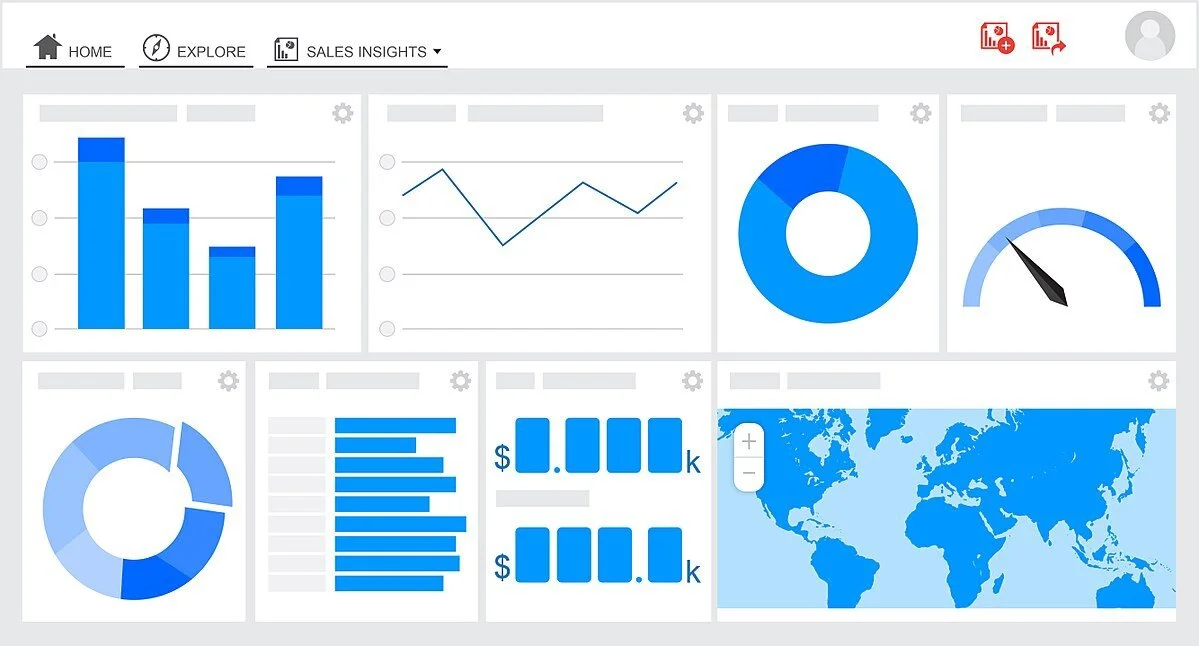
How to Manage Business and IT in a Data Integration Project

Going in to a data integration project, no matter the size can be daunting because it requires buy-off from so many different people within an organization.  One of the more difficult relationships to manage are the expectations from the business with the realities of limitations from IT.  Whether those limitations are inherent in the tools that are being selected or due to lack of proper personnel on that team, you will always have hurdles to overcome.  Here are some tips for managing the relationship and expectations between business users and technical resources in  data projects:

  1. Clearly define the project goals and expectations from the beginning, including timelines, resources, and budget.

  2. Encourage open and ongoing communication between the business and technical teams to ensure that everyone is aligned and on the same page.

  3. Assign a project manager or business analyst to act as a liaison between the two teams, ensuring that requirements are properly understood and translated into technical solutions.

  4. Ensure that the technical team fully understands the business users' needs and requirements, and that the business team understands the technical limitations and complexities of the project.

  5. Foster a collaborative and inclusive culture where everyone feels valued and respected, and where all team members feel comfortable sharing their ideas and opinions.

  6. Regularly review and evaluate the progress of the project, and adjust the plan as needed to ensure that expectations are being met and the project stays on track.

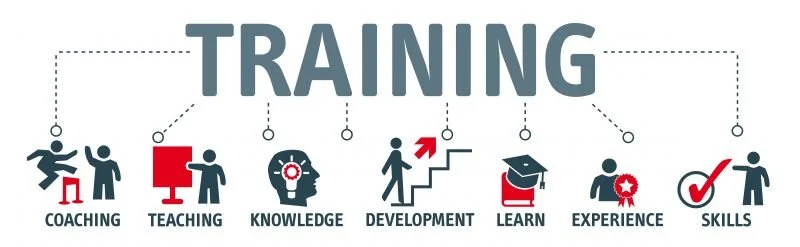
  7. Provide ongoing training and support to both the business and technical teams to ensure that everyone has the skills and knowledge they need to effectively contribute to the project.
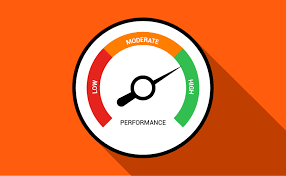
Using Power BI and Azure to create the Ultimate Solution for Business Intelligence.

If you’re looking for a top-tier solution for business intelligence, look no further than Power BI and Azure. Combining the power of Microsoft’s cloud-based analytics tools with the intelligence of their powerful analytics platform, this combination provides an unbeatable solution for businesses of all sizes.  Azure has solution pricing that will fit you Small to Medium business size needs, as well as high powered solutions to accommodate large data transfers and the ability to handle Machine Learning and AI.


At its core, Power BI is a business analytics service that provides interactive visuals, dashboards, and reports with powerful data analysis features. This makes it easy to create actionable insights that can be used to drive decisions and create innovative solutions. The combination of being one of the most cost effective BI tools on the market, one of the most powerful with its ability to create custom code in DAX and one of the easiest to develop in, makes it one of the most valuable visualization tools on the market.


Meanwhile, Azure is Microsoft’s cloud computing platform that provides a range of services for hosting, managing, and deploying applications. This makes it easier for businesses to manage their data and resources, while providing an extra layer of security. The need for a traditional DBA has been replaced by many of the features and tools that come with Azure.  Technical resources are still necessary  to setup and manage your Azure instance but the ability to cross over skills into other areas for resources is even greater. A Data Architect or Data Analyst would have the ability to manage the backend of Azure.


Together, Power BI and Azure provide a powerful platform for analyzing and understanding data. With the ability to quickly process large amounts of data, generate reports, and create visualizations, businesses can quickly identify trends and make decisions with confidence.


Additionally, Power BI and Azure are both extremely user-friendly and require no programming knowledge. This means that anyone can get started right away.

3 Reasons Why Small Businesses Need Data Reporting

Why does my small business need Data Reporting?

Let me give you 3 big reasons why you need to get started today.

  1. Track your progress

  2. Improve Training Employees

  3. Make Better Decisions

Let’s get started.

Track Your Progress

When a business first starts, it is hard to know how to measure your success. There are many different ways to track your progress. Whether it is on your expense to income ratio or on how many people sign up for your product. Whatever your goals are, you need a way to plainly see how far you have come. 

You want to keep everyone’s spirits up by showing them the progress you make. No matter how small the steps are, you want to share this information with your staff members. This allows you to keep everyone on the same page and celebrate the little things. 

The best way to see progress is using data visualization. This will allow you to see exactly what you want to track. Many departments need different celebrations and motivations. 

Tracking Progress.png

The Sales team may want to see how many sales were completed each day, week, month, or year. This allows them to see where to improve and have a clear goal to work towards. 

Your Tech department may want to keep the reported issues with the website or ordering services. This will allow them to see clear expectations and analyze what is more common to break down and implement preventative measures.

When you can track from the beginning and see your progress, you will be able to keep motivation for anyone participating in a startup or small business. The little victories make all of the difference. 

Improve Training Employees

I once worked for a company that told me that “training your employees to manage themselves will save your business more money than investing in someone with many years of experience.” I still believe that is true. 

When a business invests their time and money in helping their employees become the best version of themselves, that investment will later allow your quality to improve more than ever before. 

Training Pic.jpg

I have been that person that a company took a chance on. I did not have all of the experience or the proven track record but they were willing to work with me. They saw potential and because of that, I had a chip on my shoulder to prove that I was worth the chance they took on hiring me. I worked as hard as I could. I worked overtime and made sure nothing fell through the cracks. 

What does this all have to do with data visualization? Data visualization allows you to better train your employees. You can see where the staff pain points may be and you can train them to better meet their needs. 

Many large companies focus on the overall health of the business. Small and mid-size companies can focus on the employees and create better accountability and culture within the company. 

By utilizing the reporting software, you can improve the overall training of your staff that will in turn increase the quality of your company. 

Make Better Decisions

How can a small business use data reporting to make better decisions? When you track your data and have it plainly in front of you, your company will be able to set goals and make plans that will be easily influenced by their efforts.

Decision Making.jpg

For a marketing team, they will be able to see what activities or efforts bring in the best return of investment. Whether it be through ads or through events, they can see what effort brings in the best results. 

When planning when and where to expand your company, you can see when your best months are and plan for the future. You can see that the month with the best income would be the best time to expand your business or hire more employees. 

You may even see that your business is being overloaded with work and you need to hire more employees to balance the workload. Whatever it may be, Data Visualization allows you to make data driven decisions that will ultimately be the best decision for your business. 

Data Visualization

There are many different programs that your business may use for data visualization. Power BI, Tableau, and Domo to name a few. The best way to know which to use is by getting a professional’s opinion at which program would work best for your industry and needs. 

Data Visualization.jpeg

You may already have a program but feel like you are not using it to its full potential. Many consultants are available to help you organize and sort your data into your desired format. 

The only way someone will use a tool given to them is if it helps them complete their tasks. So if you are paying for a program but do not feel like it is helping your business in any way, Xantie is here to help you save your time and money. Xantie is able to help you organize your data into the dashboards and reports you need to make your job easier and more efficient. 

Contact Xantie at inquiries@xantie.com or call us at 801-382-7268 to get a free consultation. 


Data Analysis Basics

 What is Data Analysis?

          Data analysis is where one may review data collected over time in order to track trends or predict growth for a business.

You many analyze your data in many different ways including through paperwork, databases, or spreadsheets. Many businesses today have simplified data analysis by utilizing reporting software.

Data reporting software builds graphs, shows stats, and demonstrates the actual health of a business in an easy to read format.

            You can analyze many different aspects of any company to utilize reporting software.

You can review your financials and determine the functionality of the plans you have set in place. You may also review your HR resources and check the status of your employees.

Your marketing department may be able to analyze the cost and return of investment for their efforts so you may maximize those efforts.

Why do I need a Data Analytics for my business?

            When you can analyze the data that you have collected every year for the last 5 years, you will see trends.

You can see what months provide the best growth and what months provide the worst.

When you have the status of your business laid out so plainly in front of your face, you will be able to make easier decisions.

You can push your company in a direction of success by preparing for the rollercoaster of growth that every business experiences.

            We are supposed to learn about the past to influence our decisions in the future. By using data analysis, we can maximize this concept and set correct goals and plans for any business.

When we can see how our efforts will influence our growth, it gives us more motivation and confidence to push forward and work harder.

If anything, you can have the confidence that you are doing the right thing for your business and your employees. To learn more about data analytics and how to implement them into your business, visit www.xantie.com

Creating Accountability Through Data Reporting

There are multiple things you can do to help your business improve. Many business owners are taking advantage of data reporting tools and allowing these tools to help them grow.

But how do you use these data reporting tools to reach its potential? With there being many data reporting methods, which method is best?

There are many different paths to choose but the easiest way would be creating accountability with these tools.

As a student, you are given a series of tasks to complete outside of the classroom. Not just things that you were not able to finish during class, but a sort of test to see if you were able to apply what you were taught without the help of your teacher or professor.

These tasks were always the things that stood between you and fun activities that filled your afternoons. I am referring to, of course, homework. Homework is given to students all around the world. It is something that has become quite a standard in the education industry.

But why do we have homework? What does it accomplish?

When we were given homework, we were given a chance to be held accountable.

What does it mean to be accountable? When one is accountable, you are given expectations to complete a task and will be expected to follow up and/or present your work.

The follow up is the most essential part when someone is being held accountable. To follow up with someone about their performance allows you to reflect on the task and create goals moving forward.

Homework teaches this concept and a business should practice this concept regularly.

For a business to put trust in its employees to complete the expected project and then follow up to see how it went, productivity of that business will increase exponentially.

Now how does data reporting fall into accountability? Data reporting provides insights into the health of a business.

Whether it be in the financial department, marketing efforts, or even employee satisfaction. To expound more about this, lets focus on the financial department of a company.

Let’s say a business makes around $25,000 every October. After they notice this through a report, they set a goal and make a plan to make $30,000 this October. Then in November, they check their report again and see they made $31,000 in October.

So they can conclude that they reached their goal and had success. Now this company can move forward with confidence that their efforts do produce good results.

Implementing data reporting will enable you to have more accurate follow ups when holding your staff accountable.

Also when you provide your staff with the reports, they can feel the feeling of success when you are able to reach your goals or even exceed them.

This does not only increase the income for a business but also the satisfaction of its employees.

Data reporting is essential to help any company take the next step forward in more efficient goal setting.

The purpose of the reporting software is to make your decision making easier so you can focus on the other needs of your company. Getting started with a data reporting software is not hard.

Xantie is at your disposal to help get you started. Contact us at Inquiries@Xantie.com or visit www.xantie.com.

Race for the Cloud

One time, I sat in a meeting with one of my supervisors. After reviewing our IT

architecture, I recommended a few security improvements and expressed concerns

about data availability. He responded, "But it's in the cloud. Isn't it automatically

backed up and secure?"

Unfortunately, many others believe the same: if they move to the cloud, all their

downtime and security problems would be resolved. However, to make the best use

of those features, you must know how to manage them. But instead of diving into

how to manage cloud technologies (I recommend taking a course in managing your

cloud tool), we should first ask: which cloud provider should you choose?

While AWS currently dominates cloud technologies, other cloud providers are emerging. Azure is beginning to close the gap, as is Google Cloud.

While watching a football game with my wife, I saw an advertisement for Hewlett Packard (HP) Enterprise cloud services. There are hundreds of other cloud providers as well.

Because the cloud is powerful and cost effective, companies are increasingly investing in cloud resources, with AWS at the head.

Amazon's Jeff Bezos said: "AWS had the unusual advantage of a seven-year head

start before facing like-minded competition. As a result, the AWS services are by far

the most evolved and most functionality-rich." Indeed, AWS services has a variety of

products ranging from simple database and compute services to Machine Learning

and "Quantum Technologies". There are over 200 product offerings from AWS (I

counted 209 today). I believe AWS's main competitor is Azure. Last October,

Microsoft Azure won a $10 billion cloud contract for the US Federal Government,

despite AWS's advanced features. While I have used Google Cloud's platform for

accessing their APIs, I do not believe they are at the same level as Azure and AWS.

(But if they are, I would love to hear your thoughts) Here at Xantie, we use Azure for

our cloud services.

Why do we use Azure? Considering our suite of tools and services, Azure lends itself

well to the type of work we do for our clients. One of our stellar employees said the

following about using Azure to work with a client:

“We created a customized Power BI dashboard for them. Because we host their data

on an Azure SQL Server, we can use Direct Query mode instead of Import for their

data. This means any updates to their data would automatically update the client's

dashboards - no scheduled refreshes needed. We then integrated a Power App

within the Power BI dashboard for them to update their data, and see the change

affect their visuals in real time. Access to the dashboard and to the database are

controlled by various security features, including Azure Active Directory. Azure

makes managing their data efficient and secure.”

If you are currently using Microsoft tools, Azure is likely the way to go. If you need

something more rich and powerful, and you have the resources to do it, then AWS

may be your best bet. No matter which cloud tool you use, you will need to manage

it well. Cloud technologies on their own do not solve problems; people solve

problems with help from technology.

What do you think about Cloud technologies? Do you prefer one over another? Let

us know! We would love to hear your insights.


Measuring the seemingly immeasurable

Imagine that you are in charge of tracking your company’s Key Performance Indicators.

If you were asked to track a metric such as sales made, that would be easy.  You would probably just keep track of the number of sales made on a daily, quarterly, and yearly basis.

Now what if you were asked to track client satisfaction?  A little more difficult, right?  That’s because client satisfaction is a qualitative metric, while sales made is a quantitative metric.

Quantitative v Qualitative Metrics

Let’s talk about the difference between qualitative and quantitative metrics.  Essentially, a qualitative metric is something that is measured by quality, while a quantitative metric is something that is measured by quantity.  Quantitative metrics are often easier to measure because it can be as simple as collecting the numerical data and putting it together.

Where people get stuck is with the qualitative metrics.  How often have we been in a company that stresses the importance of increasing client satisfaction but received little to no direction on how to get to that goal? That’s because client satisfaction is harder to effectively measure.  When we’re not able to effectively measure a metric, it’s difficult for us to see a path to increase that metric.  

The ability to measure qualitative metrics both allows your company access to a greater amount of useful data and gives management the tools to see how to improve those metrics across the company.

Measuring Qualitative Metrics

Measuring qualitative metrics requires you to first define what that metric means in the context of your company’s culture and industry.

Here’s a helpful trick you can use.  You can do this exercise on your own or with your team in a brainstorming session.  

So you want to measure client satisfaction.  Think about two groups of clients. Group A is the control group--they are your current clients.  Group B consists of clients with higher satisfaction than Group A.  Start listing out the things that make Group B different from Group A. 

Group A: Control

  • 20% of clients leave reviews

  • 10% of clients return

  • Average number of referrals per client: 1

  • Average number of calls to customer service per client per month: 0.5

  • ...

Group B: Ideal

  • 60% of clients leave reviews

  • 50% of clients return

  • Average number of referrals per client: 5

  • Average number of calls to customer service per client per month: 2

  • …

After this process, you now see what is important to your company when it comes to client satisfaction.  Now when holding team meetings about improving client satisfaction, you can identify specific areas to focus on.

When metrics are defined, they can be measured; and when they can be measured, they can be improved.

---

If you’re looking for more creative solutions to your business problems, contact us here at Xantie!  We build customized solutions to help your business succeed.

Power BI: A Visual Advantage Over Your Competitors

We are all familiar with the game of chess. Each piece having a specific moving pattern and role to the game. Depending on how the player moves the piece, even the simplest pawn can be the difference between winning or losing a game. It takes knowledge to master the game of chess because each piece operates in a different fashion that when used to its fullest potential can constitute a win. Just like in chess if we use a visual tool (chess piece) for our data such as Power BI it will give us the knowledge needed to allow more critical and intelligent business decisions to be made. Just as we are all familiar with chess, we are all also familiar with the more simplistic game of checkers. In checkers, all pieces have the same roles and you have limited movements. The same is true with our data, if it is not organized in an effective visual manner than no matter how long we stare at it we will only be able to see checker pieces and make simplistic/reactionary decisions. 

Power BI Advantage

Microsoft’s Power BI is one of the most powerful data visualizers on the market. Many companies get by using Excel to organize their data and generate visuals to help them understand the data. Even though Excel is very powerful you are limited to the game of checkers rather than chess. Power BI will connect to almost any data source available. Once connected it will establish a connection that will allow automatic refreshing, so we never have to worry about having the most current data again. Just like in chess there are all different types of pieces to play with, Power BI will give you access to their complete suite of visuals that will allow us to create very informative dashboards. These dashboards will give us an advantage over our competitors and allow us to make more critical and intelligent business decisions.  

Chess PIc.jpg

Play Chess Not Checkers

We do not want to be caught playing checkers while our competitors are playing chess. With everything that is going on each company needs to be performing at their best and it can be hard to do that when we are reactionarily playing checkers with specific moves. When we have a tool such as Power BI give us a better view of the situation then we can take that knowledge and give us a competitive advantage over other businesses. We are all fighting for the same pie. Why run in and fight your competitors for the same sliver when a giant piece is sitting off to the side waiting for someone to take it? Power BI will allow us to make intelligent and calculated moves to strengthen our company’s position. All we need to ask ourselves is: Are we playing chess or checkers with our business?

Knowing the Strategic Vision of the Project

Most of us are familiar with the book or movie of ‘Alice in Wonderland’ and of one particular exchange that occurs between Alice and the most mysterious Cheshire cat. In the Wonderland book by Lewis Carroll the exchange is more involved than what is depicted in the movie so I will paraphrase the conversation in parts. When Alice asks the cat which way she should go, he replies, "That depends a good deal on where you want to go." Alice's response is that she doesn't much care where she wants to go as long as she goes somewhere.  The cat responds to Alice that if she doesn't care where she goes, then it really doesn't matter which way she goes - As long as she walks long enough, she is sure to get somewhere.

This exchange between Alice and the Cheshire Cat reminds me of many BI implementations that I have been involved with in my career.  These days, when we speak of data projects, there are many ‘Buzzwords’ that consume the market place. Whether we are talking of Big Data, Machine Learning, AI, Metadata Management, Predictive Analytics, Data Automation, or the many others that are out there; the important thing is that these topics are on the minds of business leadership.  The good thing about these buzzwords is just that – they are creating buzz within organizations and industries that previously have not dedicated time and resources to managing data and generating analytics.  The adverse effect of these buzzwords is that they are creating an environment where organizational leadership hear these concepts and task their reports to implement.  This is where we circle back to our friend Alice who knew she wanted to go somewhere without having a defined vision of exactly where she wanted to go.  For a young girl, lost in a fantastic world, that methodology is bound to create some exciting new adventures but taking a similar approach in business can lead to high software and resource costs without having added any business value in the end.

The first step to implementing a successful BI project is to understand the Key Business Questions that leadership is wanting to answer. Those Key Business Questions are those that, when answered, are going to drive company profits and efficiencies.  This is getting an understanding of the ‘What’. The ‘What’ is understanding the overall goals and objectives of the company in undergoing a BI implementation. What are the pain points?  What are the questions that need to be answered?  How can we best manage by exception?  What exceptions need to be seen in order to quickly course correct? Are you looking for more timely reports? Perhaps you lack confidence in the data being provided and you want to ensure quality of the data.  Are you not able to gain insights across multiple systems?  Is it just too costly on a weekly basis to create the necessary reports to run your business? There must be some reason for implementing a BI tool and we need to first identify what those reasons are.  It could be multiple factors mentioned or perhaps others that weren't mentioned but ultimately there are always pain points to be fixed when it comes to data.

It is important for the ‘What’ the be separated from the ‘How’.  The ‘How’ refers to the strategy of how the ‘What’ is going to be addressed.  Will it require Big Data?  Perhaps getting at the ‘What’, we need to implement Predictive Analytics and Machine Learning.  All of these decisions of ‘How’ must be derived from the ‘What’; however, too often, we see the opposite occur and purchase software that will help us become more “intelligent” in Machine Learning but we don’t understand what we need it for or how it is going to help us.  Also, while it is extremely important for the ‘What’ to come from leadership, it is just as important that leadership then trust the technical and data resources to determine the strategy of how to implement.

Don’t allow the business to be run by buzzwords. Let the buzzwords create seeds in the minds of leadership but always bring it back to the overall goals are of the BI project and let strategy be determined based off those goals.


How to Implement a Successful Business Intelligence Platform

W. Edwards Deming (Engineer, Statistician, Professor, Author, Lecturer and Management Consultant) said, "In God we trust; all others bring data." With that quote in mind, I have often heard of a Gartner report that between 70% to 80% of Business Intelligence projects fail.  I usually stick with the mantra that "90% of all statistics are made up on the spot"; However, in my experience that statistic does not seem too far off.  I have dedicated my life and career to data and to business intelligence because there is so much power in the ability to back up words, ideas and thoughts with meaningful data and analytics.  I know how important data is to business and how much of a competitive advantage can be derived from knowing key indicators that drive the bottom line.

I can't speak to the complete accuracy of the notion that upwards of 80% of business intelligence projects fail but in my professional experience in having worked with hundreds of clients in their Business Intelligence endeavors, I can certainly attest to the fact that the failure rate is high.  There are several key factors that I have seen in my career as to why these projects either don't get off of the ground, lose momentum, fail to prove ROI or are simply rejected for various reasons in the end.  I certainly don't pretend to know all of the reasons why a project may fail and I can't list all of the pieces a project must have in order to be successful.  I have, however, identified 9 steps that have been beneficial both to me and to my clients as we have gone through the journey of BI.  Over the next several weeks, I'm going to expound on each of those 9 steps - why they are important and where the potential pitfalls are in each one of them.  As I go through this process, I welcome any feedback or thoughts that others can provide.  I want to reiterate, I don't pretend to be able to give the end all solution but I hope to provide some thought provoking insight into the world of Business Intelligence.

IDENTIFY KEY STAKEHOLDERS

The first step in creating a successful analytics program is identifying the key people who will be involved in both the project and the use of the application.  First is identifying the various types of stakeholders who may be involved. This could range from the Executive Sponsor (CEO, CMO, COO, etc…) to the Analytics Director or to the business analyst who is used to generating manual reports on a daily or weekly basis.

The importance of integrating Project Sponsors at the management level cannot be overstated.  Executive buyoff for the project is integral in the overall success of the project as clear expectations and common goals need to be made at this level.  It is also important to sell current capabilities when discussing the high prioritized items that are needed for quick wins and momentum gains within the first weeks of the project.  I have seen too often where future capabilities are sold without the ability to execute and it quickly derails the project, creates distrust in the relationship and removes the feeling of being a true partner to achieve common goals.

It is also important to understand what pieces of the project are important for each person within the team.  For an executive sponsor, they are going to want to see metrics at a high level that will give them the ability to ask necessary questions that are important to the overall success of the company.  Next, for an analytics director or business analyst, it is important that they have the ability to further dive down into the data to get at the 'WHY' of the questions that are being asked from the higher management.  Ease of access, speed to insight and ROI are also going to be very important to the executive sponsors; Whereas, integration, data quality, ease of report creation will be items that are important for the data architects and business analysts.

Now that there is an understanding of who is going to be involved in the various aspects of the project and what areas are going to be important for them, it is now imperative to understand how the project is going to affect them in their everyday work.  New processes and technologies have a tendency to make people nervous. They don't understand what it may mean for the future of their roles within the organization or they may not feel comfortable learning a new process or software.  To help alleviate some of these concerns, it is important to understand their current processes.  Dive into the weeds as much as possible in order to get a feel for their current methods of reporting, ETL (Extract, Transform, Load), data cleansing and data distribution.  Figure out important questions such as - Who does each person report up to and how will the new process affect their current line of communication?

Once we have a greater understanding and insight into each team member's role, it is now important to address how each of their current job functions may be affected.  Ultimately, there is a reason we are rolling out a major BI implementation. It may be to create efficiencies within processes, to be able to combine multiple data sources into a single location, to provide real time data, etc… Any one of these reasons will have a positive impact on both the organization as a whole as well as the individual players on the team.  Roles may have to change but those changes are generally for good - even for the individual contributors that are affected. At this point, it is important to bring team members into the discussions and decision-making processes for the project. Involve those who will be affected by the change into the conversations quickly. You want them to feel like they have a say in the process. Get them invested in the project.  This will ensure project support and will deter a lot of the push back you get when you simply push a process or technology on to an individual or team. This isn't to say that each member should be in every meeting.  You certainly don't want a business analyst to override the vision of the CMO but it is important to approach the business analyst, in the context of the overall vision, and let him or her contribute thoughts on how that vision can be executed at his or her level.

In our next segment, we will discuss more in depth the process of understanding organizational goals and the need to set priorities based on the Pareto Principal of identifying the fewest Key Performance Indicators that will have the greatest impact within the business.