Why does my small business need Data Reporting?
Let me give you 3 big reasons why you need to get started today.
Track your progress
Improve Training Employees
Make Better Decisions
Let’s get started.
Track Your Progress
When a business first starts, it is hard to know how to measure your success. There are many different ways to track your progress. Whether it is on your expense to income ratio or on how many people sign up for your product. Whatever your goals are, you need a way to plainly see how far you have come.
You want to keep everyone’s spirits up by showing them the progress you make. No matter how small the steps are, you want to share this information with your staff members. This allows you to keep everyone on the same page and celebrate the little things.
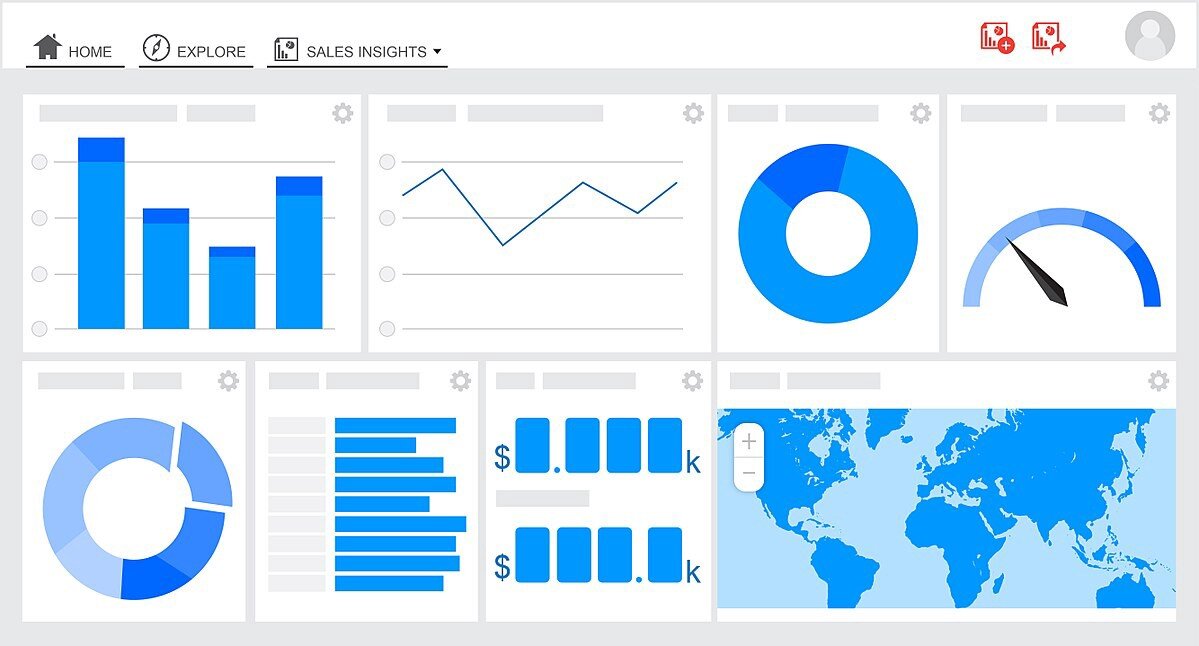
The best way to see progress is using data visualization. This will allow you to see exactly what you want to track. Many departments need different celebrations and motivations.
The Sales team may want to see how many sales were completed each day, week, month, or year. This allows them to see where to improve and have a clear goal to work towards.
Your Tech department may want to keep the reported issues with the website or ordering services. This will allow them to see clear expectations and analyze what is more common to break down and implement preventative measures.
When you can track from the beginning and see your progress, you will be able to keep motivation for anyone participating in a startup or small business. The little victories make all of the difference.
Improve Training Employees
I once worked for a company that told me that “training your employees to manage themselves will save your business more money than investing in someone with many years of experience.” I still believe that is true.
When a business invests their time and money in helping their employees become the best version of themselves, that investment will later allow your quality to improve more than ever before.
I have been that person that a company took a chance on. I did not have all of the experience or the proven track record but they were willing to work with me. They saw potential and because of that, I had a chip on my shoulder to prove that I was worth the chance they took on hiring me. I worked as hard as I could. I worked overtime and made sure nothing fell through the cracks.
What does this all have to do with data visualization? Data visualization allows you to better train your employees. You can see where the staff pain points may be and you can train them to better meet their needs.
Many large companies focus on the overall health of the business. Small and mid-size companies can focus on the employees and create better accountability and culture within the company.
By utilizing the reporting software, you can improve the overall training of your staff that will in turn increase the quality of your company.
Make Better Decisions
How can a small business use data reporting to make better decisions? When you track your data and have it plainly in front of you, your company will be able to set goals and make plans that will be easily influenced by their efforts.
For a marketing team, they will be able to see what activities or efforts bring in the best return of investment. Whether it be through ads or through events, they can see what effort brings in the best results.
When planning when and where to expand your company, you can see when your best months are and plan for the future. You can see that the month with the best income would be the best time to expand your business or hire more employees.
You may even see that your business is being overloaded with work and you need to hire more employees to balance the workload. Whatever it may be, Data Visualization allows you to make data driven decisions that will ultimately be the best decision for your business.
Data Visualization
There are many different programs that your business may use for data visualization. Power BI, Tableau, and Domo to name a few. The best way to know which to use is by getting a professional’s opinion at which program would work best for your industry and needs.
You may already have a program but feel like you are not using it to its full potential. Many consultants are available to help you organize and sort your data into your desired format.
The only way someone will use a tool given to them is if it helps them complete their tasks. So if you are paying for a program but do not feel like it is helping your business in any way, Xantie is here to help you save your time and money. Xantie is able to help you organize your data into the dashboards and reports you need to make your job easier and more efficient.
Contact Xantie at inquiries@xantie.com or call us at 801-382-7268 to get a free consultation.


